The opening-range breakout is one of the oldest ideas in index trading: let the market build a range overnight, then trade the direction it breaks when the cash session opens. It is simple enough to explain in a sentence — which is exactly why most published versions fall apart the moment you charge realistic costs.
We ran the DAX (DE40) version properly: 14 years of one-minute data (2013–2026), real spreads, fixed-lot sizing, and results measured in R-multiples rather than flattering dollar figures. Here is what held up, what didn’t, and why the answer has as much to do with execution as with the strategy itself.
The strategy at a glance
Market DAX / DE40 (and Nikkei) Opening range 03:00–09:00 Frankfurt time (overnight, ending at the cash open) Entry Buy-stop at range high / sell-stop at range low Stop Opposite side of the range (= 1R) Target 2 × range (2:1 reward-to-risk) Exit Flat by 13:00 if neither hit Frequency ~4–5 trades/week, one per day Headline (H1, 14yr) Profit factor 1.25 · Sharpe 1.46 · +206R
How a single trade plays out
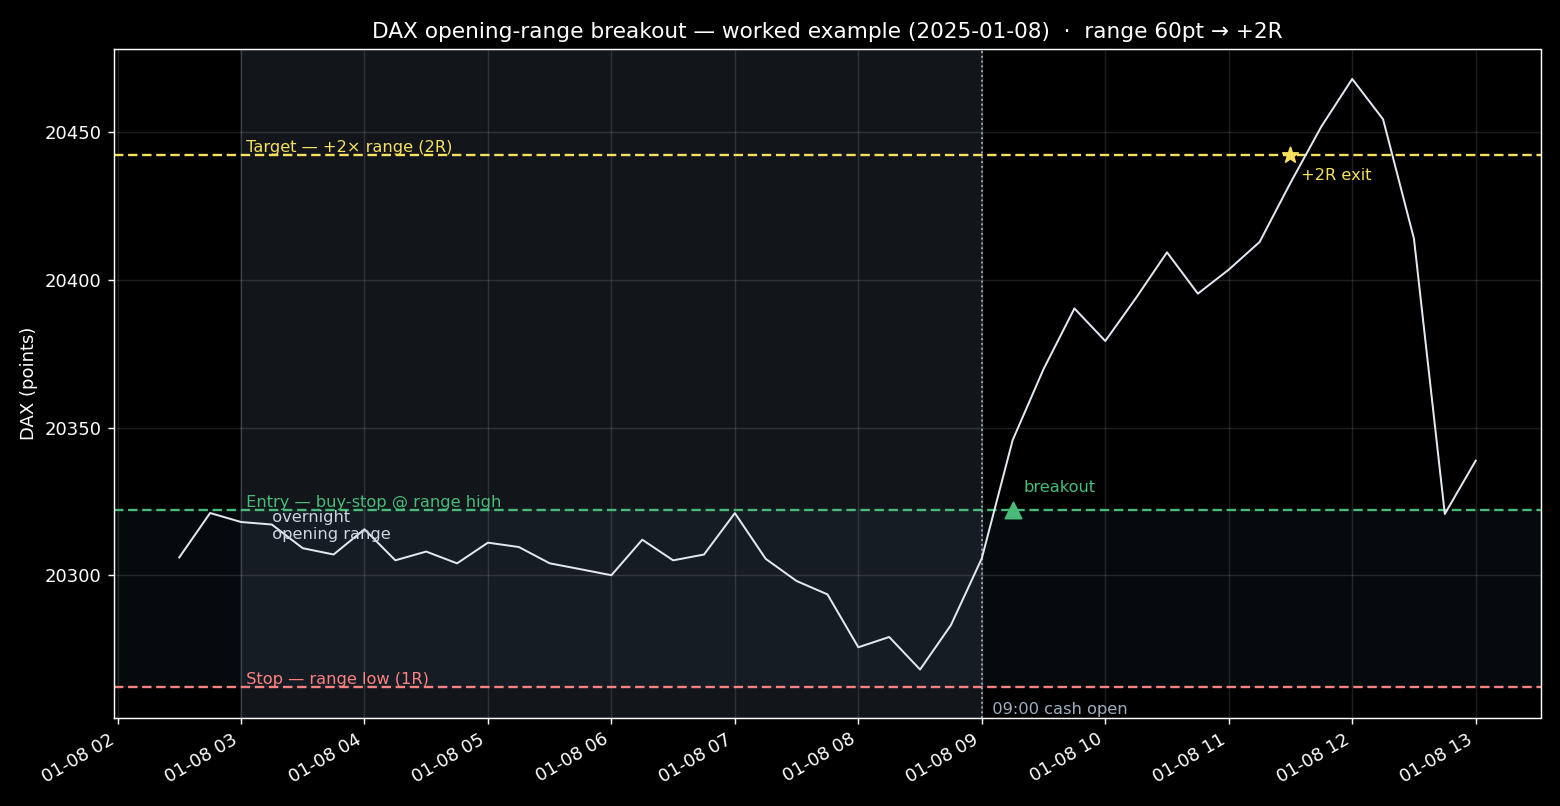
The market spends the overnight session building a range. At the 09:00 open, price breaks above the range high, triggering the resting buy-stop. The stop sits one range-width below (the range low); the target sits two range-widths above. On this day the breakout ran cleanly to the +2R target by late morning. Most days are messier — but the expectation across thousands of these is what we measured.
The result
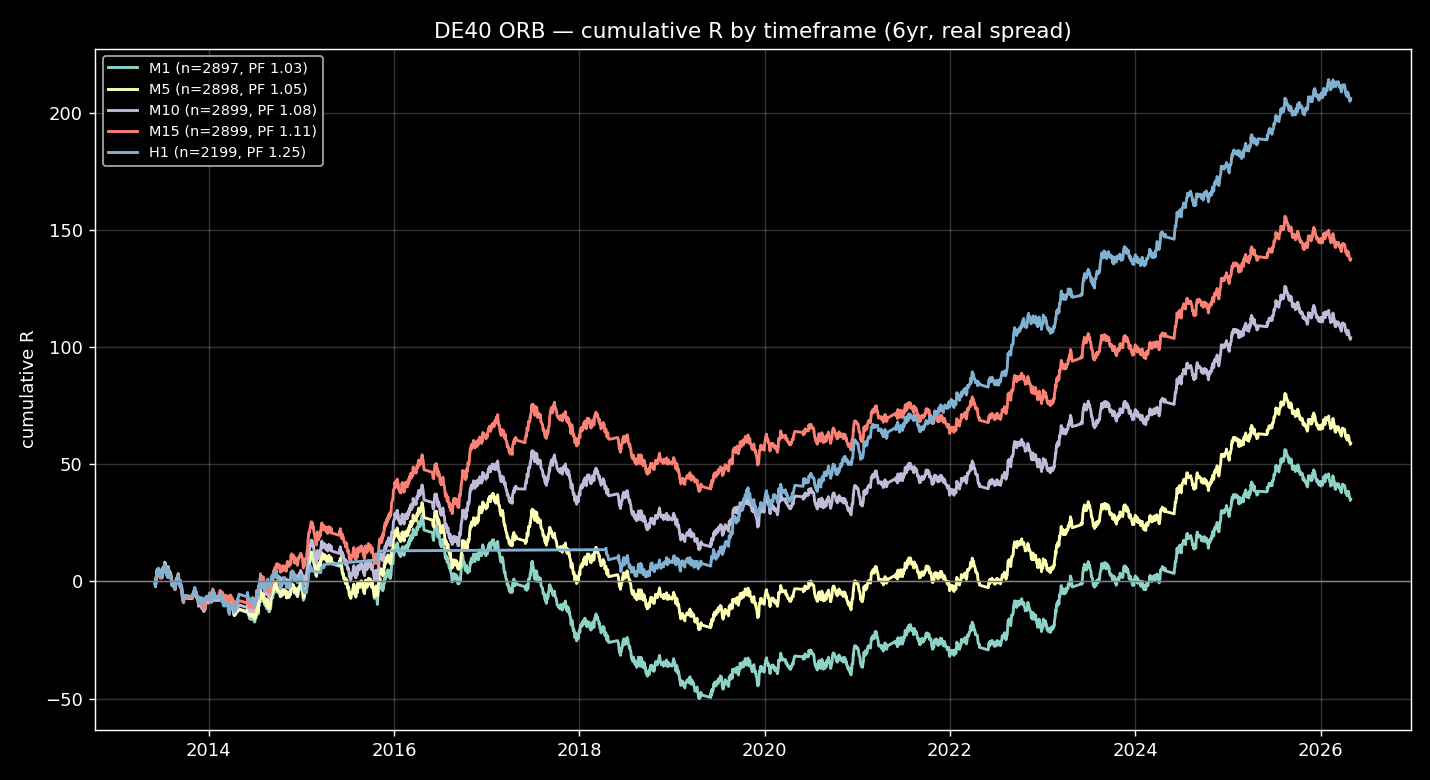
Over fourteen years, net of a realistic spread, the strategy compounds steadily:
| Timeframe | Trades | Win rate | Profit factor | Total (R) | Max DD (R) | Sharpe |
|---|---|---|---|---|---|---|
| H1 (best) | 2,199 | 49.4% | 1.25 | +206 | −21.4 | 1.46 |
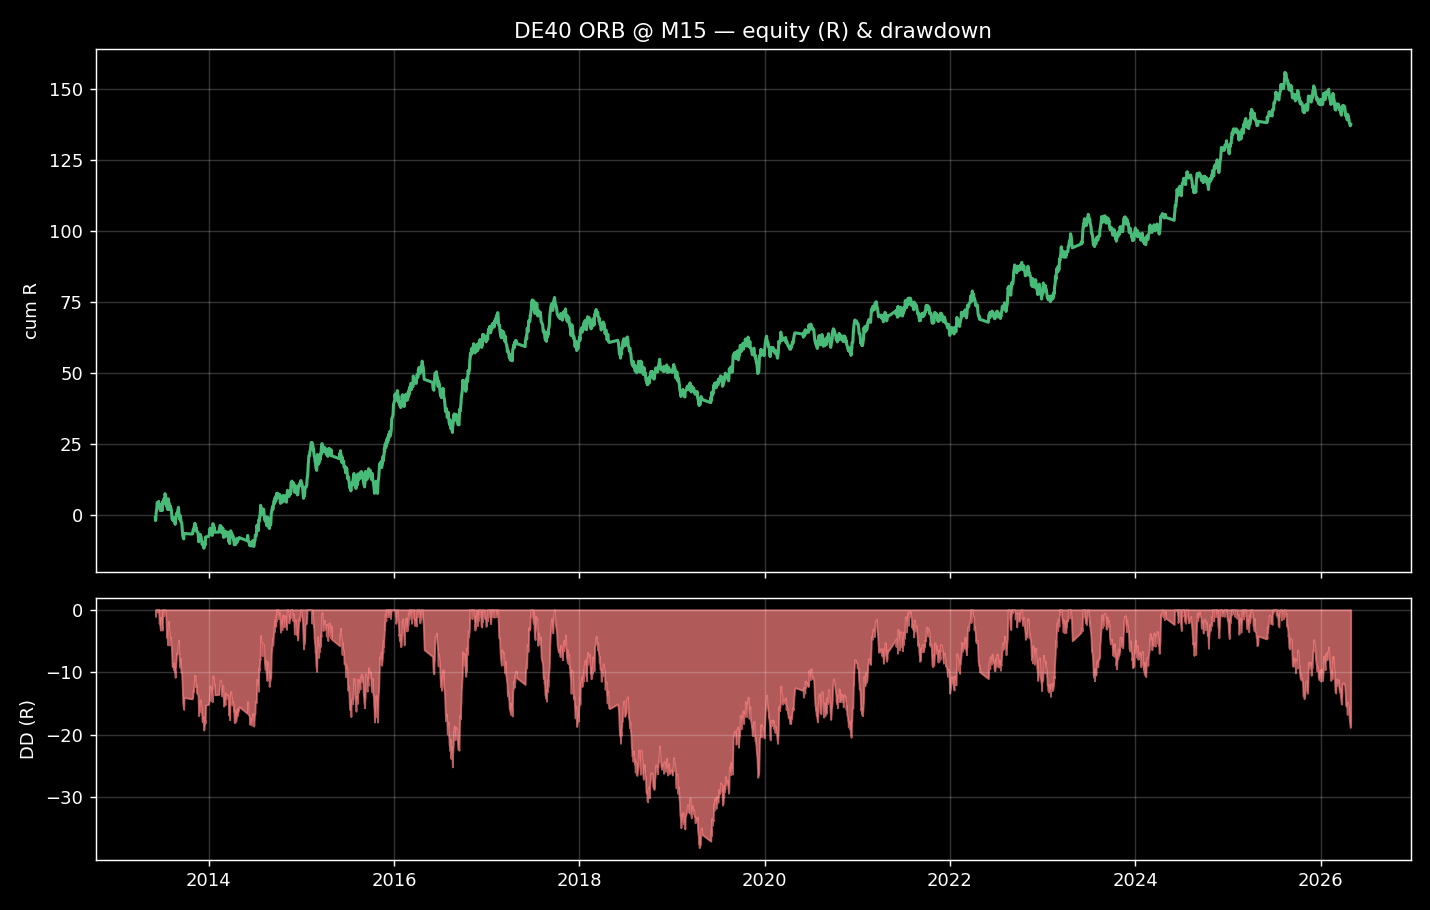
| M15 | 2,899 | 46.4% | 1.11 | +138 | −38.1 | 0.70 |
The average winning setup is roughly a 90-point DAX move, against which the spread cost is about 4% of the trade. It is not a money machine — the per-trade expectancy is modest, around a tenth of an R. What makes it credible is consistency: positive in 9 of 14 years, with no blow-up year (the worst lost under 10R).
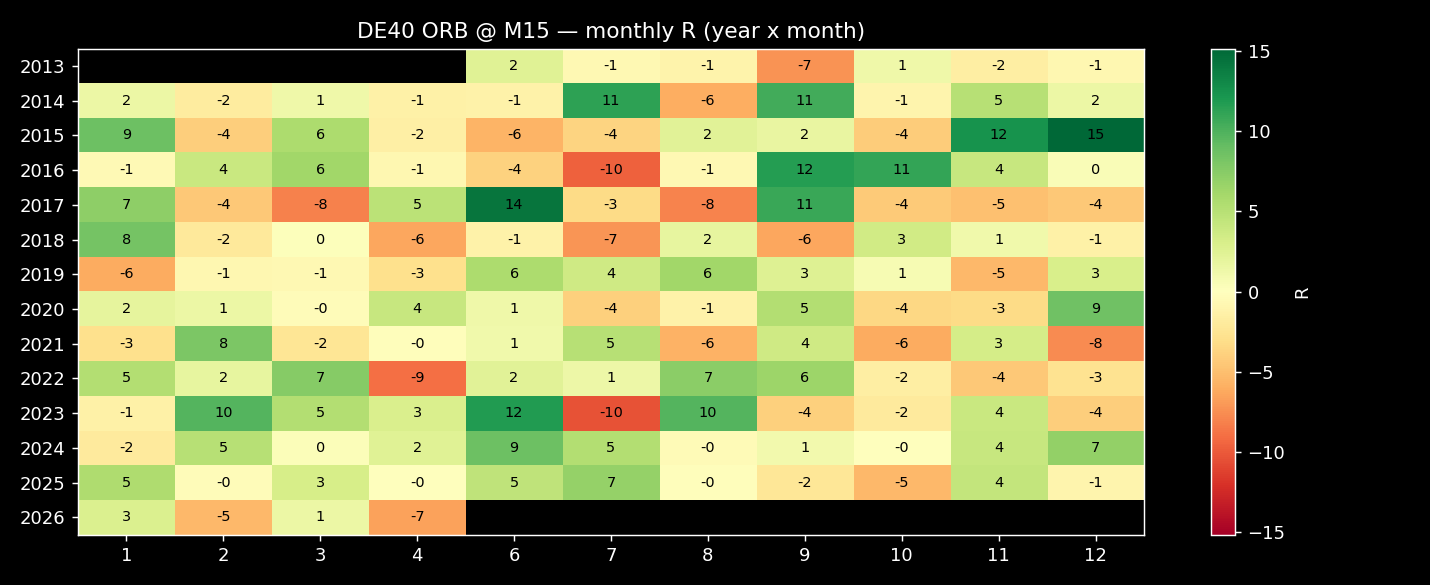
Year by year
| Year | R | Year | R | Year | R |
|---|---|---|---|---|---|
| 2014 | +19.7 | 2018 | −9.7 | 2022 | +14.3 |
| 2015 | +26.8 | 2019 | +6.0 | 2023 | +21.6 |
| 2016 | +22.1 | 2020 | +10.3 | 2024 | +31.2 |
| 2017 | −0.3 | 2021 | −4.1 | 2025 | +15.2 |
Stress-testing it
A backtest is only as honest as the abuse it survives.
Out-of-sample. Split the history into an early “training” half and a later “test” half — the edge holds in both. It isn’t a curve fit to one regime.
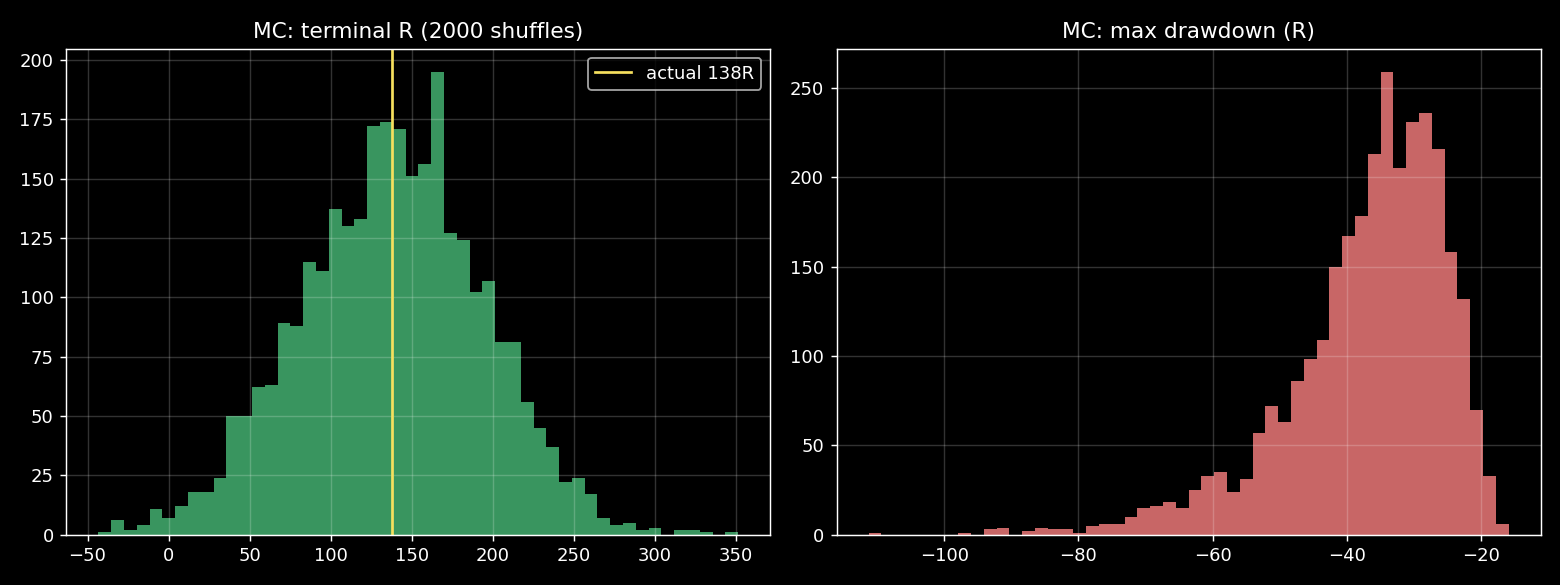
Monte Carlo. Resample the trade sequence 3,000 times. Even the unlucky 5th-percentile outcome stays profitable (+43R). The drawdowns are survivable, not catastrophic.
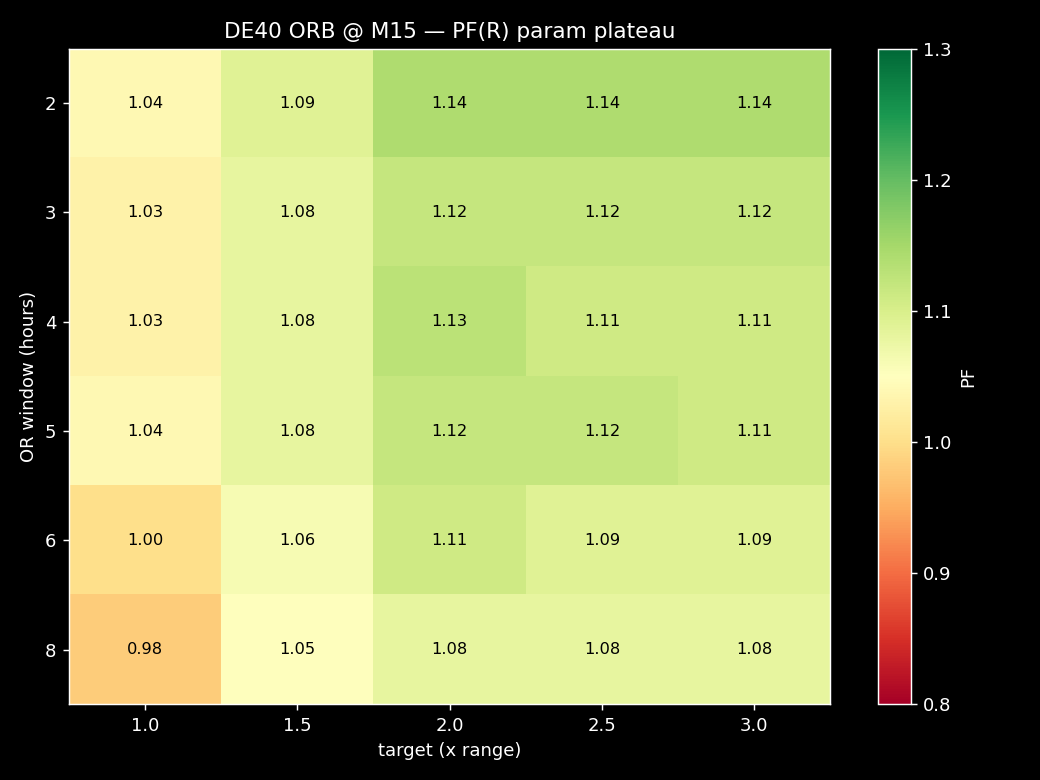
Not curve-fit. The profit factor stays above 1 across a broad plateau of opening-range windows (3–8 hours) and targets (1.5–3× range) — not balanced on one lucky parameter cell.
Versus randomness. A random-entry version over the same windows loses more than 1,000R. The edge is in the signal — the open-auction impulse against the overnight balance — not in the market drifting up.
When you exit, and which days
Two checks that matter in live trading — and both reinforce that this isn’t a fragile, over-tuned setup.
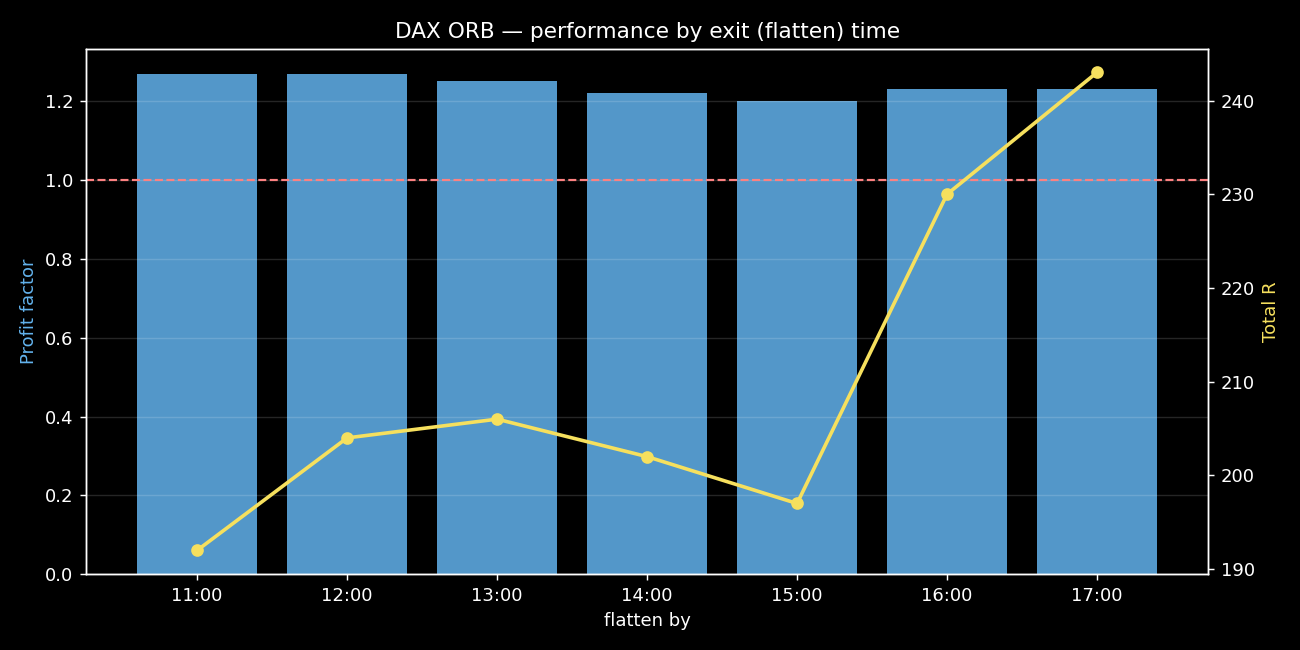
The exit time is not a magic number. Whether you flatten at 11:00 or hold all the way to the DAX close at 17:00, the profit factor stays in a tight 1.20–1.27 band. The edge doesn’t depend on a precisely-tuned exit. In fact, holding longer captures more total return — winners keep running — at a slightly lower win rate:
| Flatten by | Profit factor | Total R |
|---|---|---|
| 11:00 | 1.27 | +192 |
| 12:00 | 1.27 | +204 |
| 13:00 | 1.25 | +206 |
| 14:00 | 1.22 | +202 |
| 15:00 | 1.20 | +197 |
| 16:00 | 1.23 | +230 |
| 17:00 (cash close) | 1.23 | +243 |
Every weekday is profitable, and the edge is strongest mid-week. Tuesday and Thursday carry the most (profit factor 1.35 and 1.39); Monday is the weakest but still green. There is no day to avoid, and no single day the edge depends on:
| Day | Profit factor | Total R | Win rate |
|---|---|---|---|
| Monday | 1.12 | +20 | 48.9% |
| Tuesday | 1.35 | +59 | 50.2% |
| Wednesday | 1.22 | +37 | 48.2% |
| Thursday | 1.39 | +60 | 50.1% |
| Friday | 1.18 | +31 | 49.7% |
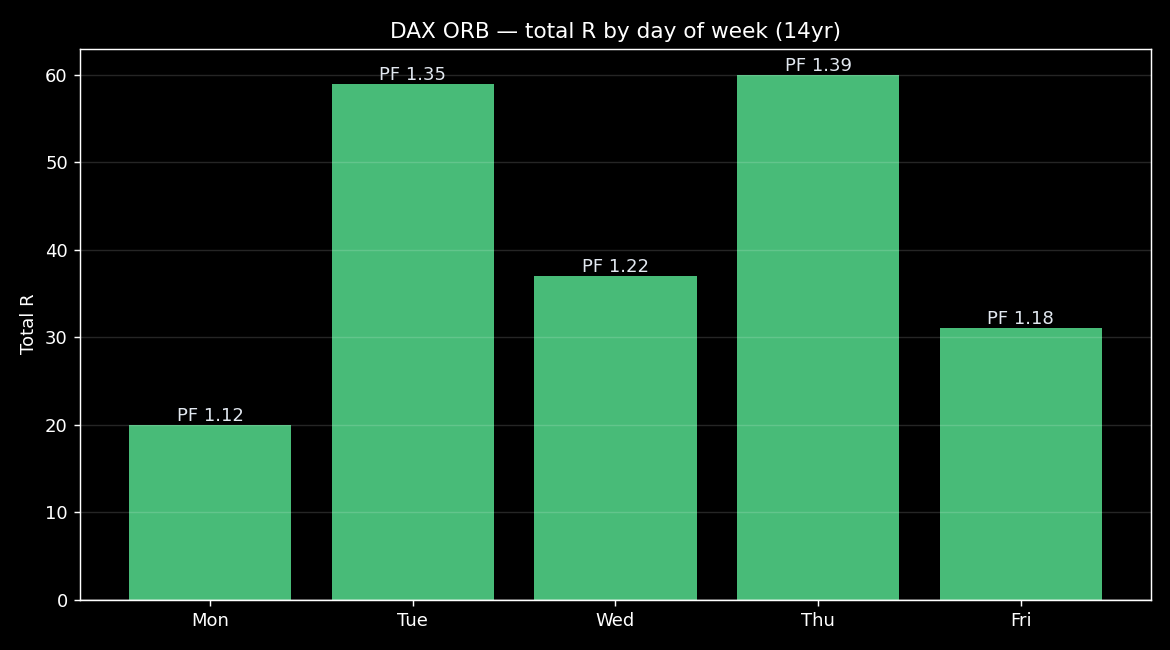
This is exactly the shape you want: the edge is spread across exit times and weekdays rather than concentrated in one lucky cell — the opposite of an over-fit backtest.
It doesn’t work everywhere — and that’s the interesting part
We ran the identical logic across ten global indices. The result is sharp:
| Market | Profit factor (H1) | Verdict |
|---|---|---|
| JP225 (Nikkei) | 1.33 | Works — best of all |
| DE40 (DAX) | 1.22 | Works |
| UK100 (FTSE) | 1.08 | Marginal |
| US500 (S&P 500) | 0.99 | No edge |
| US30 (Dow) | 0.92 | No edge |
| US100 (Nasdaq) | 0.90 | No edge |
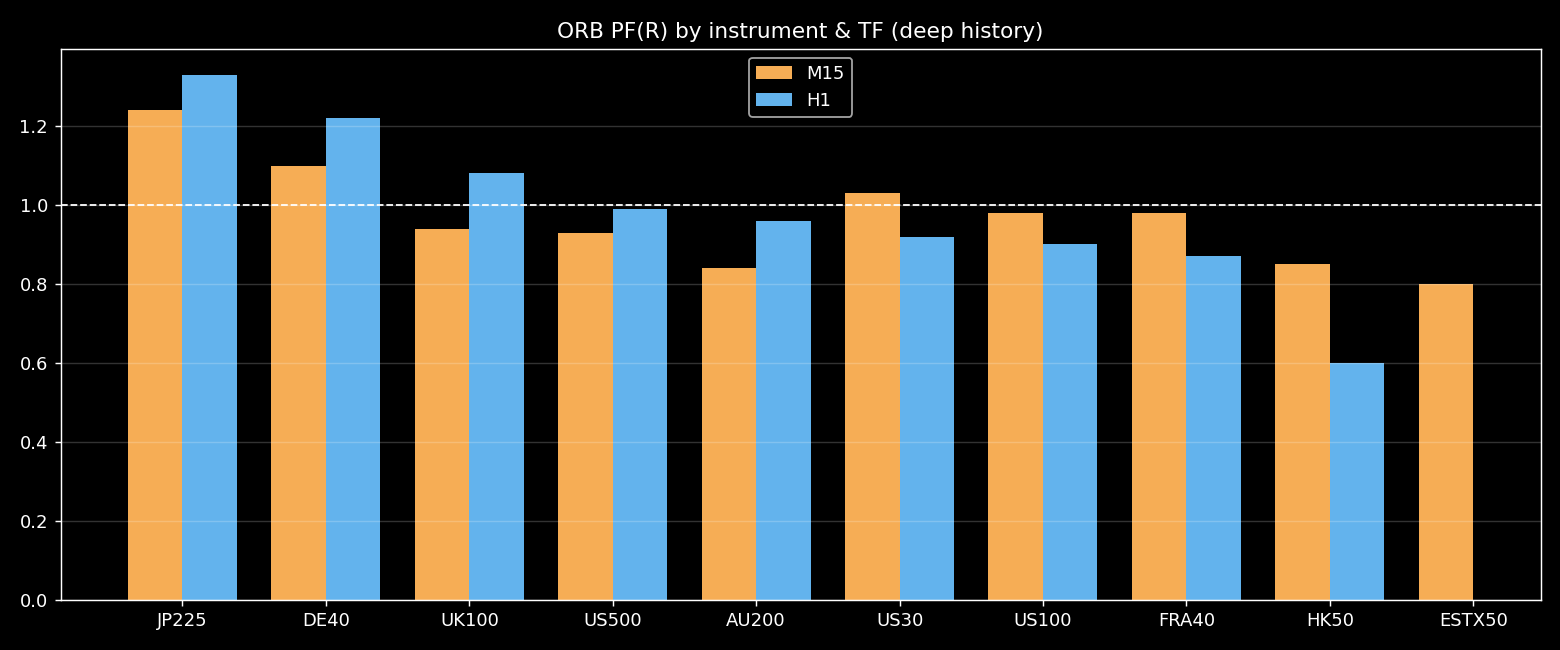
This makes sense once you think about who is on the other side. The European and Asian opens partly react to what already happened during US hours — there is genuine pent-up order flow to release, and it tends to extend the overnight range. The US open has no such “catch-up”: it is the lead market, so its open doesn’t break the overnight range cleanly. A strategy is a bet on a specific market microstructure, not a universal pattern.
Why this is really a story about execution
Here is the part most strategy write-ups skip. The DAX ORB edge is real but thin — about a tenth of an R per trade. The single biggest threat to a thin edge is the gap between the price you should get and the price you actually get.
This strategy fills at a stop order sitting on the range boundary, triggered in the most volatile second of the day: the cash open — precisely when spreads widen and price moves fastest. So we tested exactly that. Here is the same strategy with increasing slippage added to every fill:
| Slippage per trade | H1 profit factor | H1 result | M15 profit factor | M15 result |
|---|---|---|---|---|
| 0 pts (ideal fill) | 1.25 | +206R | 1.11 | +137R |
| 1 pt | 1.20 | +166R | 1.06 | +75R |
| 2 pts | 1.14 | +126R | 1.01 | +13R |
| 3 pts | 1.10 | +85R | 0.96 | −49R |
| 5 pts | 1.01 | +5R | 0.88 | −174R |
Read the 15-minute column: three points of slippage turns a winner into a loser. On a home connection pinging the broker at 50–150 ms, the open-auction breakout routinely moves several points between the trigger and your fill — and the strategy quietly stops working, with nothing in a naive backtest to warn you. (When we ran the same test on the related RSI(2) reversion model, realistic slippage erased its edge completely.)
That is the entire reason a low-latency VPS exists. Co-located a few milliseconds from your broker’s matching engine, your stop orders fill at the level rather than after price has run through it. For a breakout strategy that lives and dies on fill quality, that is not a marginal convenience — it is the strategy.
In plain dollars
R-multiples are deliberately size-agnostic, but to make it concrete: if you sized each trade to risk €100 (one R), the H1 version’s +206R over 14 years is on the order of €20,000 of modelled edge from a single instrument — before the slippage above eats into it. Scale the risk, scale the number. The point isn’t the figure; it’s that the figure is fragile to execution, which is the one variable you can actually control.
The honest caveats
This is a research study, not financial advice, and not a signal we sell. DAX CFD data before 2015 is thin, so we treat the clean record as 2014–2026. Brackets are modelled conservatively (stop-first on ambiguous bars). Live trading adds broker-specific quirks, financing, and your own discipline. Past performance does not guarantee future results, and trading leveraged products carries substantial risk of loss.
What the study does show is a principle worth more than any single strategy: a tradeable edge is a small number that real costs can erase, and the cheapest performance upgrade available to a systematic trader is the one between their order and the exchange.
FXVPS runs low-latency trading servers co-located beside major broker datacenters in New York, London, and Frankfurt — built for exactly the kind of execution-sensitive strategies above. See VPS plans, check your broker’s latency, or read why every trader should consider a VPS.